

Housing foreclosure activity has been climbing steadily since the pandemic-era lows, and the latest data from the Federal Reserve Bank of New York puts the trajectory in sharper focus.
According to the New York Fed’s quarterly Household Debt and Credit Report, analyzed and visualized by ResiClub PRO’s Lance Lambert, U.S. housing foreclosures reached 55,160 in Q2 2026. That figure sits 16% below pre-pandemic Q2 2019 levels of 65,920, a significant narrowing from the 88% gap recorded at the trough in Q2 2021, when foreclosure activity fell to just 8,100 as federal moratoriums and forbearance programs held the market in suspension.
The full decade of data puts the current moment in perspective:
Q2 2014: 115,300
Q2 2019: 65,920
Q2 2021: 8,100
Q2 2026: 55,160
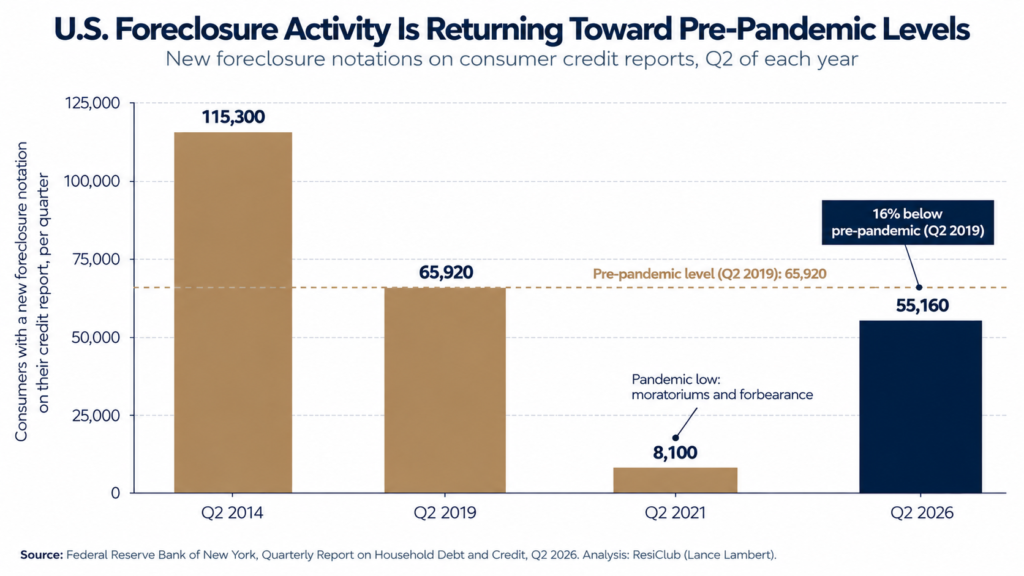
The pandemic suppression of foreclosure activity was the product of deliberate policy intervention, not underlying market health. Federal moratoriums, extended forbearance programs, and a historic surge in home prices that pushed borrower equity to record levels all combined to keep foreclosure filings artificially low for an extended period. As those conditions unwound, the return toward pre-pandemic levels has been gradual and, so far, orderly.
That national trajectory also masks real variation underneath it. As of ATTOM’s July 2026 data, foreclosure rates are highest in Nevada, South Carolina, and Florida, while the broadest measure of mortgage distress, balances that are delinquent, in forbearance, or in foreclosure, currently concentrates in Louisiana and Mississippi. Notably, that distress is not landing hardest in the post-boom correction markets an investor might expect, places like Austin or Cape Coral that ran up the most during the pandemic. It’s showing up instead in states hit by insurance cost shocks and consumer credit stress specific to those local economies. At the other end, foreclosure activity across much of the Northeast, including Vermont, Rhode Island, and South Dakota, remains close to negligible. This cycle is being driven by state-specific economic and insurance pressures more than by a single national housing story.
“The delinquency data tells the same story at an earlier stage of the pipeline. Mortgage delinquencies of 90 days or more stood at 1.0% of household mortgage balances in Q2 2026, just above the pre-pandemic Q2 2019 level of 0.9% and well below the 3.4% recorded in Q2 2014. Part of that increase is a reporting artifact rather than new mortgage stress: student loan delinquencies began appearing on credit reports again in mid-2025 after years of pandemic-era suspension, and the New York Fed found that borrowers with credit scores above 760 who carried unpaid student loan balances saw those scores drop by an average of 171 points as a result. That shock likely pushed some borrowers to the sidelines of the housing market this year and may be inflating the mortgage delinquency read by a modest amount. Thirty-day delinquencies, which aren’t affected by that reporting change, have already returned to pre-pandemic levels, which historically precede movements in 90-day delinquencies and eventually in foreclosure filings.”
One complicating factor in reading the current delinquency data is the student loan effect. In mid-2025, student loan delinquencies began being reported to credit bureaus again after years of pandemic-era suspension. The New York Fed documented that borrowers with credit scores above 760 carrying unpaid student loan balances saw their scores drop by an average of 171 points as a result of that reporting resumption. The Treasury has also resumed collection activity including wage garnishment and tax refund seizures. How much of that credit shock flows through into mortgage delinquencies and eventual foreclosure activity remains an open question.
Lambert’s analysis suggests that based on current delinquency trends, foreclosure activity is likely to increase modestly over the next 12 months absent a significant shift in the macro environment. A recession scenario would change that trajectory materially, but the base case points to continued gradual normalization rather than acceleration.
For investors evaluating private credit and mortgage note funds, the distinction between normalization and crisis matters considerably. The current foreclosure environment reflects a market returning to historical operating conditions after an extraordinary period of policy suppression, not a system under the structural stress that characterized 2008 to 2012. Borrower equity levels remain substantially above pre-pandemic levels in most markets, which changes the resolution dynamic for distressed loans in ways the foreclosure count alone does not convey.
Headlines comparing today’s numbers to 2008 make for an easy story, but the comparison doesn’t survive contact with the data. 2008 was a systemic credit collapse: loose underwriting, negative equity, and a banking system over-leveraged against mortgage risk, all failing at once. None of those conditions are present here. What we’re looking at is a market working its way back to a normal range after years of policy-driven suppression, with tight underwriting and real borrower equity underneath it the whole way. The data warrants attention. It doesn’t warrant the alarm being sounded around it.
Source: Federal Reserve Bank of New York Household Debt and Credit Report, Q2 2026. Foreclosure and delinquency data visualized and analyzed by Lance Lambert, ResiClub PRO Report, September 2026.
Continue Exploring Note Investing With 7e
Ready to Start Investing?